Why Your App Isn’t Making Money (And How To Fix It)
The short answer
How to monetize an app that gets downloads but no money
An app can get plenty of downloads and still barely make money when every step is a little weak: a sign-up wall before any value, onboarding that never asks the user's goal, a paywall that pushes the plan buyers choose least, and a store page that doesn't say what the app is for. Fix measurement first, because you can't tell whether a fix worked if you can't see the number it should move.
Key facts
- $0.66Revenue per download by day 60 for a typical (median) Health and Fitness app. The bottom quarter makes $0.23.RevenueCat, State of Subscription Apps 2026 (p31)
- 6.9%Median share of downloads that start a free trial in Health and Fitness apps. The bottom quarter is 2.7%.RevenueCat, State of Subscription Apps 2026 (p52)
- About 4 in 100Fitness subscriptions sold that are weekly. About 68 in 100 are yearly.RevenueCat, State of Subscription Apps 2026 (p85)
- Delay sign-inApple's design guidance: people often leave when forced to sign in before they can do anything useful.Apple Human Interface Guidelines, Managing accounts
Chapters
- 0:00How to monetize an app: the teardown
- 0:47What happens in an app's first ten minutes?
- 2:17Why does this paywall lose people?
- 3:40What happens after someone pays?
- 5:01How do people find the app?
- 6:07How does it compare with a typical fitness app?
- 7:21Where is the biggest leak?
- 8:30What's the plan to fix it?
Transcript
Edited for readingCobalt is a fictional workout app built for this series; its screens are illustrative and its scoreboard is modelled from the sources below, not measured. Every benchmark is real.
How to monetize an app: the teardownWatch from 0:00
This fitness app gets 8,000 downloads a month, and it's barely making money. From each month of downloads, it makes about $1,800 in the first two months. A typical fitness app with the same downloads makes about $5,300. Same downloads. Nearly three times the money.
This is Cobalt. Over this series we'll fix it one part at a time. You'll see every screen before and after.
Today is the teardown. We'll go through Cobalt's first ten minutes as a new user. We'll find where the money leaks, and decide what to fix first. And the first fix isn't the one you'd guess.
Cobalt is a workout app we built for this series, so its screens are made up. The benchmarks are real. They come from RevenueCat's 2026 report on more than 115,000 apps, and from AppTweak.
What happens in an app's first ten minutes?Watch from 0:47
Let's be that new user. We just downloaded Cobalt, and we want to get stronger at home.
The splash screen is clean. Cobalt looks like a finished, polished app, and that's on purpose. Nothing here is badly designed. Every problem we find is a decision.
The first decision comes before we've seen a single workout. Cobalt asks us to create an account. Apple's own design guidelines say to delay sign-in for as long as possible. People often leave when they're forced to sign in before they can do anything useful.
We sign up anyway. Now the questions start. Our name. Our age. And on the second screen, a request to send us notifications. Why would we say yes? We don't know what Cobalt will send us yet. A permission asked before it means anything is easy to refuse. And once someone says no, the app usually can't ask again.
Then twelve more screens. Fourteen in all. Not one of them asks what we want to get better at.
Here's the surprise. Length isn't the mistake. One small study of 26 fitness onboarding flows found a median of about 20 onboarding screens.
The mistake is that every screen is about Cobalt's form, not our goal. And at the end, there's no plan. Nothing says: here are your next twelve weeks. We wanted to get stronger at home. The app never asked, so it can't show us a plan that fits.
Our take: onboarding is the first workout. If it doesn't feel like progress, people quit before they start.
Why does this paywall lose people?Watch from 2:17
Next, before we've done a single push-up, comes the paywall. Its headline sells features, not results. A list of six features: unlimited workouts, advanced statistics, priority support. Nothing about the goal we just gave it.
Three plans side by side. The one already picked for us is weekly, at $7.99 a week.
In fitness apps, how many of every hundred subscriptions sold are weekly? About four. In RevenueCat's data, fitness is the category where weekly plans sell least. About 68 in every hundred are yearly. So Cobalt's default points every new user at the plan length fitness buyers choose least.
That matters after the sale too. Weekly subscriptions leave faster than monthly ones. In a typical fitness app, only about six in a hundred weekly subscriptions are still active after six months.
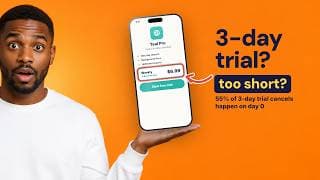
Two more things. The close button is small and faint, up in the corner. And the three-day free trial only appears in the fine print.
We covered how price changes what an app earns in Why Your App Pricing Isn’t Working (And How To Fix It). The trial question is in Why Your 3-Day Free Trial Isn’t Working (And How To Fix It).
Our take: this paywall sells a list of features to someone who came for a plan.
What happens after someone pays?Watch from 3:40
But say we start the trial anyway. What happens next decides whether we ever pay.
Here's the home screen. A grid of workouts, bright artwork, and no plan. Nothing says what to do today. Nothing counts the days we've shown up. No streak, no week one of twelve.
We pick a workout, and the player itself is good. Clear timer, clear moves, rest that counts down.
Then the next morning at nine, one notification: time to work out. The same words every day, whoever we are, whenever we train. One message, at one time, for everyone. It's easy to ignore, and easy to switch off for good.
Here's where retention sits. In RevenueCat's data, after six months, about one in five monthly fitness subscriptions is still active. That's the median. We've set Cobalt at the bottom quarter: about one in eight.
And there's a quieter leak. When a card payment fails, Cobalt counts it as a cancel. No grace period, no reminder, no offer to come back. When someone does decide to cancel, they leave through the store's settings. Cobalt has nothing set up to ask why, or to offer a pause.
And yearly plans have their own cliff. In a typical fitness app, only about a quarter of yearly subscriptions renew for a second year. Those are fixes of their own, later in the series.
How do people find the app?Watch from 5:01
But keeping people only matters if people arrive. So how do they find Cobalt? Most of Cobalt's downloads start on its store page.
The name is "Cobalt - Workout App". The subtitle: "Fitness for everyone". Neither tells a searcher what makes Cobalt different. Behind the scenes, the keyword field repeats words that are already in the name, so they add nothing.
And the screenshots are plain screens from the app, with no captions. When there's no preview video, Apple says the first one to three screenshots show up in search results. So they need to say what the app is for.
On the US App Store, fitness apps average about 18 downloads for every hundred page views. We've set Cobalt at under 13.
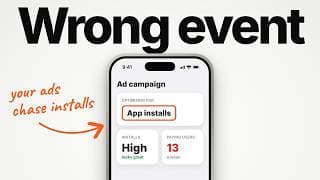
Then the ads. One Meta campaign, optimising for installs, running one old feature video. Meta's own docs say that optimising for an action inside the app reaches people likely to take it, not just people likely to install. Cobalt asks for installs, so that's what it gets.
There are no Apple Ads, while rivals bid on Cobalt's name. No Google campaigns. One price in every country, and English only.
How does it compare with a typical fitness app?Watch from 6:07
That's the whole app. Now let's put numbers on it. This is Cobalt's scoreboard. Every number on it is modelled, not measured. We set Cobalt at the bottom quarter of fitness apps wherever the data has one, using RevenueCat and AppTweak. Then we compare it with the typical app.
Out of every hundred downloads, a typical fitness app gets about seven free trials. Cobalt gets under three. Of every hundred trials, a typical app turns about 38 into payers. Cobalt, 26.
Now run one month through that. 8,000 downloads. 216 trials. 56 paying users. The median app gets the same 8,000 downloads. It turns them into about 550 trials, and around 208 paying users. Nearly four times as many people paying.
That's why the money gap is so wide. By day 60, a typical fitness app has made about 66 cents per download. Cobalt has made 23. Twenty-three cents.
Across a month of downloads, that's about $1,800 against $5,300. A gap of more than $3,000, from the same 8,000 downloads.
Our take: a bottom quarter app doesn't need one miracle. It needs every step to be ordinary.
Where is the biggest leak?Watch from 7:21
So which step do you fix first? Line every step up against the median, and one is furthest behind. Store page conversion and trial to paid are both at about 70% of typical. Download to trial is under 40%.
Because we put every line at the bottom quarter, this shows where fitness apps spread out most. That's where a weak app falls furthest behind.
It's also the biggest prize. Matching the typical app at that one step would mean about 340 more trials a month. Same downloads. That points at the sign-up wall, the onboarding and the paywall.
So fix onboarding first? That's the obvious move. But there's a problem. Cobalt's team has never seen this scoreboard. Their dashboard shows one number: downloads. No trials, no payers by source, no revenue per install. And the ad platforms only ever hear about installs.
Every number you've seen today came from category data, not from Cobalt. A real team in this spot would be guessing.
So the first fix isn't onboarding. It's measurement. You can't tell whether a fix worked if you can't see the number it was meant to move.
Our take: the first fix for most struggling apps is the one nobody ever sees on screen.
What's the plan to fix it?Watch from 8:30
Here's the plan. Sixteen fixes, in this order, then a finale with the whole app side by side.
First, measure. Then the money core: onboarding, the paywall, then pricing and trials. Then keeping people: the first week, then renewals and win-back. Then being found: the store listing, the screenshots and icon, and checkout on the web. Then paid growth, one channel at a time: Apple Ads, Meta with new creatives, then Google. And last, going global, a growth model with a budget, and scaling.
Each fix moves only the numbers it could plausibly touch, by the cautious end of a real, published result. And each one gets its own before and after.
Every fix also leaves something you can use on your own app: the event plan, the onboarding map, the paywall spec, the keyword set, the campaign structures and the growth model.
What this can't tell you: these benchmarks are medians across many fitness and medical apps in one year. They show where apps sit, not what one change will do. A real app's leak only shows up in its own data.
Cobalt's dashboard says it's doing fine. Here's why its numbers are lying: Why Your Mobile App Tracking Is Wrong (And How To Fix It).
Sources
- RevenueCat, State of Subscription Apps 2026 (115,000+ apps, 2025 data; Health and Fitness includes Medical; pages 31, 52, 58, 85, 106, 115)
- AppTweak, Average app conversion rate per category (US, 2025 data; Health and Fitness App Store average 18.2%) (18 May 2026)
- Apple Human Interface Guidelines, Managing accounts ("Delay sign-in for as long as possible")
- Apple Developer, notification permission (the system stores the answer and doesn't prompt again)
- Apple Developer, App Store product page (first one to three screenshots in search results when there's no app preview)
- Meta for Developers, Optimizing your app ad (app event optimisation)
- Lazyweb, How many onboarding screens do health and fitness apps have? (26 flows from 24 companies) (7 July 2026)
Caveat: Cobalt's numbers are modelled (each line at the bottom quarter, or 0.7x the average where only an average exists); $1,840 and $5,280 are 8,000 downloads x revenue per install at day 60; 216 and 552 trials, 56 and 208 payers, and +336 trials are Appelune calculations from the medians and quartiles above. Medians are across many apps in one year: they show where apps sit, not what one change will do. Retention figures count subscriptions, not people. AppTweak's figure is an average with no sample size published.